Operations Dashboards: Metrics Worth Watching
The short list of metrics that actually change behaviour in a portfolio, how to set thresholds, and how to spot a number that is measuring the wrong thing.
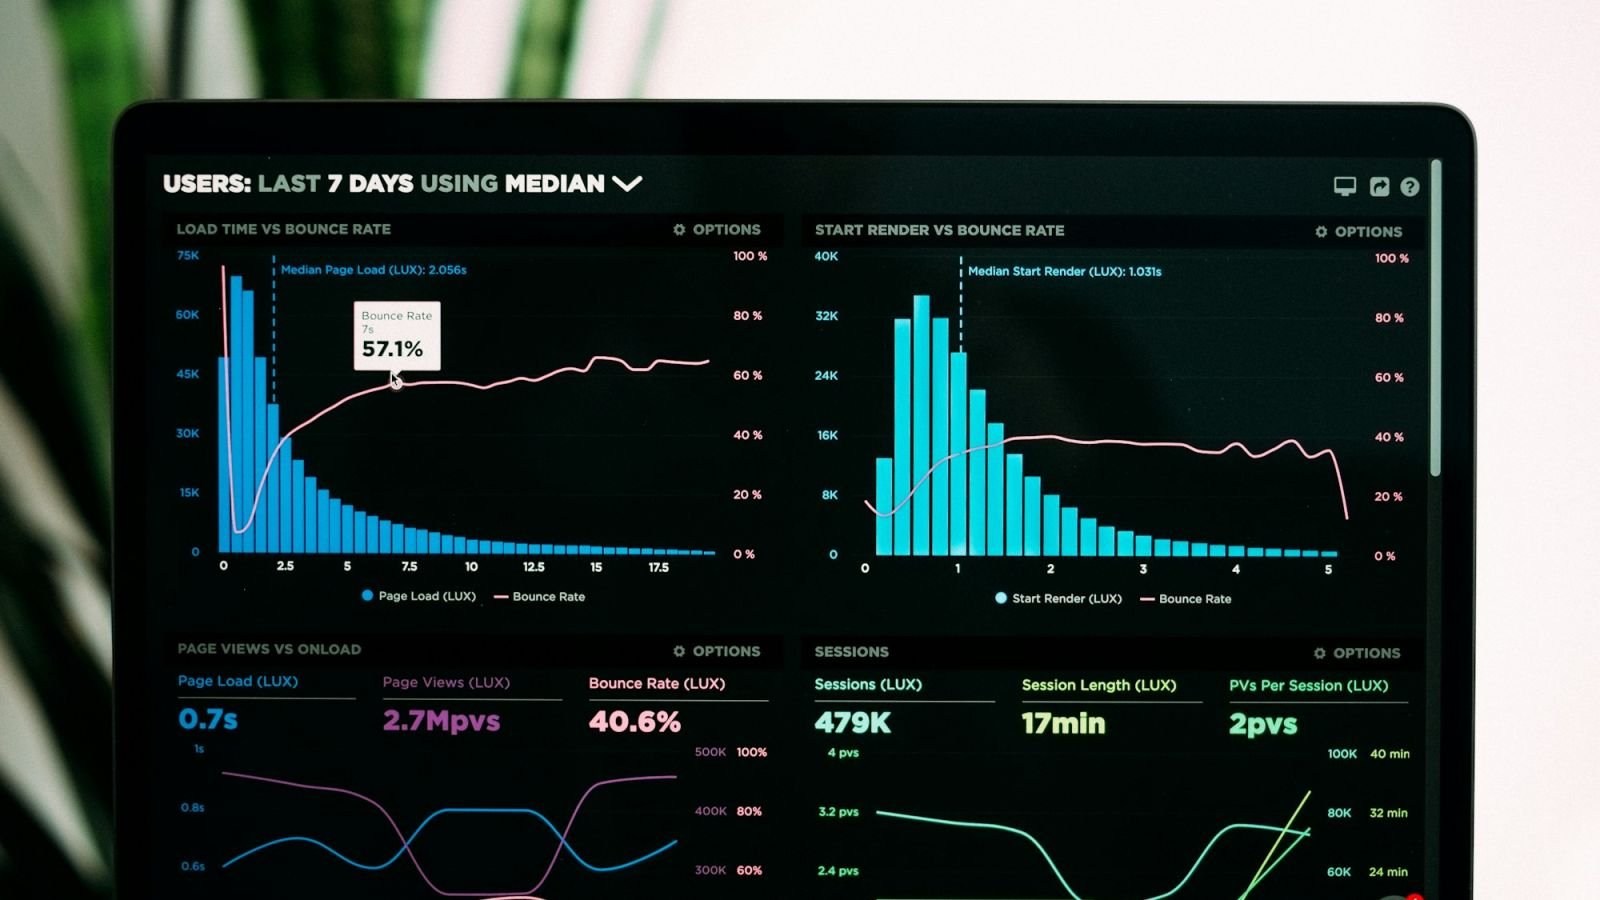
Every portfolio has a dashboard. Very few have a dashboard that has ever changed what someone did on a Monday. The difference is not the software and it is not the chart type — it is whether each number carries a threshold and a named response.
Property operations metrics are worth having when a rise or fall forces a decision. That single test eliminates most of what portfolios measure, and it leaves a short list that a regional manager can actually run a week from.
Key takeaways
- A metric earns its place only if breaching it changes what someone does next week.
- Six to eight numbers is enough for a portfolio dashboard. Beyond that, attention spreads thinner than the data.
- Every number needs three attachments: a written definition, a threshold and an owner.
- Report coverage beside every average. A score from half the scheduled inspections is not a measurement, it is a sample.
- Watch one leading metric — critical items found — alongside the lagging ones, or you will always be reading history.
Which property operations metrics are worth watching?
Six, plus one that prevents surprises. They cover condition, coverage, closure, repeat failure, service, vendor delivery and imminent risk — and each has a response attached.
| Metric | How it is computed | Working threshold | What happens when it is breached |
|---|---|---|---|
| Inspection coverage | Inspections completed ÷ inspections scheduled | Below 95% | Manager reassigns the cycle; gap recorded |
| Condition score | Weighted APPA 1–5 average per building | Building below 3.0 | Deficiency plan with dates, reviewed monthly |
| Critical item failures | Count of critical items scored 3 or below | Any single occurrence | Work order same day — critical |
| Deficiency close-out | Median days from finding to closure, by priority | Above 1, 7 or 30 days by priority | Overdue list to owners; escalation after five days |
| Repeat failures | Items found again at the same location within 90 days | Above 15% of closed items | Root cause review, not another repair |
| Service response | Median time to first response, by request priority | Above 4 hours urgent, 24 hours routine | Rota and staffing review |
The seventh is the leading indicator: open high-priority items trending up two months running. It is not a score, it is a direction, and it usually arrives before the condition score moves.
Thresholds above are house defaults, not regulation. Adopt them, publish them, and change them only in writing — a threshold that moves quietly is worse than no threshold.
How many metrics should a dashboard carry?
Six to eight on the main view, with everything else one level down. The number is not arbitrary: it reflects how many items a manager can scan and act on in a five-minute Monday review without losing the thread.
Two failure modes are common: the data dump — forty tiles because the system can — and the single number — one average that hides the failing building.
A workable structure has three layers:
- Portfolio view. The six measures, each against its threshold, plus open high-priority items.
- Building view. The same measures for one building, plus the item-level detail behind a score.
- Record view. The inspection itself — areas, items, photos, deficiencies. Where the argument gets settled.
The dashboard is not the record. It should point at the record, in two clicks, with the date and the inspector visible.
What makes a metric untrustworthy?
Four things, and each looks like an ordinary number until you ask how it was produced: poor coverage, an undefined scale, an uncalibrated inspector, and a target that pays for itself.
- Low coverage. A 4.3 average from six of eleven scheduled inspections is a sample, not a condition assessment. Publish coverage beside the score, always.
- Undefined scale. "Average cleanliness score of 4.1" means nothing without the scale, the areas included and the weighting. Definitions belong in one page, versioned.
- Uncalibrated inspectors. Three managers scoring to three interpretations produce a portfolio average that reflects staff, not buildings. Blind paired scoring fixes it.
- A target that games itself. If a manager's review depends on the score, scores will drift upward. Separate the inspection score from the manager's performance rating, or watch the definition of "closure" stretch.
A quick diagnostic: pick a random deficiency that shows as closed and ask to see the photo and the date. If the answer takes more than five minutes, the closure metric is measuring administrative optimism.
How do you set thresholds that trigger action?
Start from the response, not the number. Decide what the team will do when a measure crosses a line, then set the line where that response is worth the cost.
A practical method for a portfolio, on any metric:
- Define the action first. For deficiency close-out, the action is an escalation email to the owner and a re-dated commitment.
- Pick the volume the team can absorb. If the response team can handle ten escalations a week, the threshold should produce around eight in a normal week.
- Compare with a quarter of history and adjust only if the line produces meaningless silence or constant noise.
Leading and lagging measures: why both?
Lagging measures tell you what happened; leading measures tell you what is about to happen. A portfolio dashboard needs at least one of each, or the review is always a post-mortem.
The most useful leading indicator is count of open high-priority items and their age: two months of rising counts almost always precede a falling score, because the score catches up with what nobody fixed. The second is repeat failures, which measures whether repairs are diagnoses or gestures.
Lagging measures — average scores, close-out times, tenant satisfaction — are needed for the owner conversation, because they match how the owner thinks about the asset. Keep them; just do not confuse them with steering.
How should a dashboard read on a Monday morning?
Top to bottom: what is off-threshold, what changed, what is at risk this week, then the portfolio averages. A reader should know in fifteen seconds whether this week needs intervention, and in five minutes what to do about it.
Design rules that survive contact with busy managers:
- Colour only for exceptions. If everything is green with arrows, colour is decoration. Reserve it for breached thresholds.
- Trend arrows with a period. An arrow without "vs last month" or "vs same month last year" is ambiguous.
- Sort by risk, not by alphabet. The building with the worst open items belongs at the top, not the one whose name starts with A.
- Show the date of the last inspection on each building row. A score without a date is not comparable.
Screenshots of charts are not the deliverable. The dashboard's job is to send someone to a building with an item list, and the report format that follows is covered in regional manager reporting.
What do you do when a metric looks too good?
Check the measurement before the celebration. A sudden improvement in condition scores or close-out times usually means a changed definition, a new inspector, a smaller sample, or a target that has begun to pay.
Three routine checks catch most of it:
- Coverage and sample size for the period in question, compared with the previous period.
- Inspector mix, because a change in who inspected changes what "the portfolio" scored.
- The definition version, if the item list or the scale was edited mid-period.
A genuine improvement looks like this: coverage steady or rising, the same inspectors, the same definitions, and the improvement concentrated in areas where specific deficiencies were closed. Anything else is worth a conversation before it goes in the report.
IFMA's research and benchmarking programme is a reasonable external reference, though external comparisons only mean something once internal definitions have been stable for several quarters.
How do you compare buildings without misleading yourself?
Compare like with like, and compare each building mainly with its own history. Cross-building league tables are the fastest way to make a dashboard distrusted, because the building with the food court, the older roof and the double shift always loses.
Three adjustments remove most of the unfairness:
- Group by building type and age band, and compare within the group.
- Normalise by area and traffic, particularly for cleaning scores, so a 20,000 sq ft lobby and a 200,000 sq ft mall concourse are not treated as equivalent.
- Show the delta, not the rank. "Up from 3.4 to 3.7" is more actionable than "8th of 21".
The full method, including which adjustments are worth the effort, is in benchmarking sites fairly across a portfolio.
How do you keep a dashboard alive?
Review the metric set every quarter and delete anything that has not changed a decision in two quarters. Dashboards decay by addition — every incident adds a tile, and within a year the useful measures are buried among eleven nobody reads.
A quarterly review with three questions is enough: which tiles did anyone click last quarter, which thresholds were breached, and what was done about each? Tiles with no clicks and no consequences come off. That review is also the loop that keeps an inspection programme moving forward rather than accumulating, as set out in continuous improvement in facilities operations.
CCOHS applies the same logic to safety programmes in its guidance on programme elements: measurement and audit are useful only where the findings are followed up, with target dates and checks that confirm completion. A dashboard with no follow-up mechanism is a wall of numbers.
Frequently asked questions
How many metrics should a property operations dashboard show?
Six to eight on the main view. Each should have a defined owner and a threshold, and everything else should sit one level down, reachable in two clicks. More than that and the review becomes a reading exercise.
Should we track tenant satisfaction?
Yes, but once a quarter and with a recorded method, not as a weekly tile. Satisfaction moves slowly and is easy to misread from a small sample.
What is a reasonable target for inspection coverage?
95% or better of scheduled inspections completed and filed. Below that, the condition scores stop representing the portfolio, and the gap itself should be reported rather than smoothed out.
Our scores keep improving but complaints have not fallen. Why?
Usually because the score is measuring what the inspector can see in a scheduled visit, while complaints reflect what happened between visits. Add repeat failures and service response to the set, and check whether inspection timing is predictable.
Do we need dashboards in year one?
No. In the first year, a monthly one-page report with three measures and a deficiency list does the job. Dashboards earn their cost once the volume of inspections makes assembly the bottleneck.
A dashboard with fewer numbers
A good dashboard is a short list of commitments: what we measure, what is not acceptable, and who acts when the line is crossed. Everything else — chart types, refresh rates, colour schemes — is detail that will not survive a bad month.
The measures only become trustworthy after the routine that produces them is stable, which is the argument in property management operations, and the mechanics of scoring are covered in inspection metrics for managers.
NeatScore produces the numbers at source: area-specific checklists on APPA 1–5 scoring, critical items flagged, a photo per item, offline inspections that sync, deficiency tracking with close-out dates, and dashboards that cut the same records by building, area and month. Try it free for 14 days, or see pricing.